What is FX volatility breakout?
Strategies and Indicators [Precautions are also explained!]
There are probably many people who want to capture rapid price fluctuations and make profits with FX. FX volatility breakout strategy is one of the powerful tools for that. In this article, we will explain in detail what a volatility breakout is, its strategies and indicators, and precautions for success.
After reading this article, you will understand the basics of volatility breakouts, learn how to implement the strategy, and maximize your profits. In addition to success, you will also be able to manage risk and minimize losses.
Learn the FX Volatility Breakout Strategy and explore how to take advantage of market fluctuations to pursue profits. First, let's explain volatility breakout in detail.
What is FX volatility breakout?
In conclusion, a volatility breakout refers to a phenomenon in which a situation where the market has been calm and little movement has suddenly changed due to a certain event or factor. In other words, the price suddenly moves from being within a certain range to suddenly moving beyond that range.
In this situation, the market is likely to become active and create important trading opportunities for traders. Volatility breakout can be said to be a key concept in deciphering market trends.
We will explain the mechanism and specific examples in detail.
structure
The mechanism of volatility breakout is a complex interplay of market psychology and technical factors. Generally speaking, volatility increases rapidly when the market's perceived support, resistance, or price range is broken. This increase is due to an increase in trading volume due to a succession of stop-loss orders and new orders.
For example, when prices are near the top of a range, there will be an increase in limit sell orders from contrarian traders. When the upper limit of this range is breached, the stop-loss order (buy order for settlement) of traders with short positions will be activated. Additionally, new buy orders will be placed by traders who have confirmed the range break. As a result, buy orders dominate the market as a whole over sell orders, causing volatility to spike.
Example

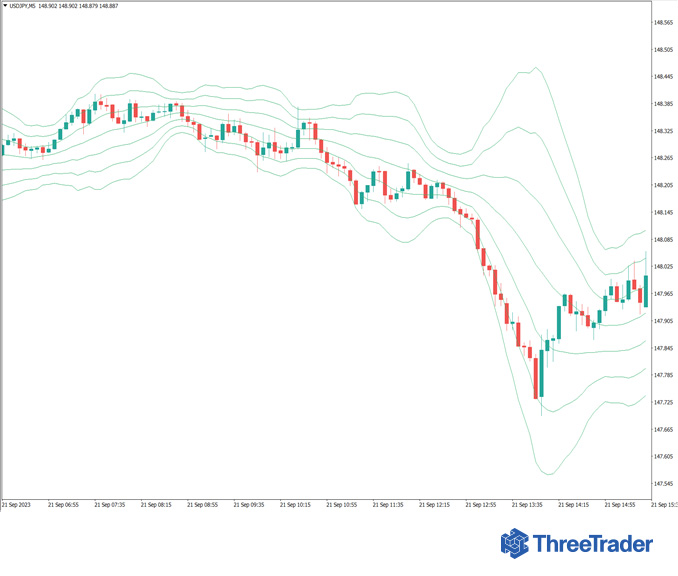
A commonly used technical indicator is Bollinger Bands. This indicator is very useful for measuring price volatility and is used by many traders on a daily basis. When Bollinger Bands are narrower, it is interpreted as less volatility in the market. This condition is called a "squeeze," and many traders keep a close eye on it.
Once the squeeze is removed, the price will start to move rapidly and the Bollinger Bands will widen. This phenomenon is called "expansion" and many traders are aiming for this moment. When an expansion occurs, it can also be interpreted as a major trading opportunity. By taking advantage of this situation, traders can increase their chances of making big profits in a short period of time.
Furthermore, a volatility breakout strategy using Bollinger Bands can have a higher probability of success when combined with other technical indicators and fundamental analysis. For example, by using it in conjunction with other indicators such as moving averages and RSI (relative strength index), you can more accurately understand the timing of entry and exit.
FX Volatility Breakout Strategy and Indicators
If you take advantage of the rapid price movements of volatility breakouts in your trades, you can make profits. Volatility breakout strategies are the cornerstone of trading on market fluctuations. However, in order to take advantage of it, it is essential to understand the indicators used to capture price fluctuations.
In this section, we will explain in detail the indicators that are important for volatility breakout strategies.
ADX

ADX (Average Directional Index) is a technical indicator used to measure the strength of market trends.
ADX is especially useful for analyzing markets before volatility breakouts occur. When ADX shows a low value, it indicates a weak market trend. A high ADX value indicates that a trend is occurring.
Generally, ADX above 30 is considered a strong trend, and below 30 is considered a weak trend. In MT4, the indicators ADX and ±DI are displayed as a set.
ADX is an indicator that shows trend strength, but not direction. If the +DI line is pointing upwards and the ADX value is 20 or higher, it is determined that an uptrend has occurred. Similarly, if the -DI dorsal line rises and ADX is 20 or higher, it is determined that a downtrend has occurred.
In the USD/JPY 4-hour chart above, ADX is 41 and the +DI line is upward, confirming that an upward trend is occurring.
standard deviation
Standard deviation is a statistical measure of how far price fluctuations are from the average. This concept is often used in everyday life, such as the "deviation value" in school test scores. In technical analysis, Bollinger bands use the concept of standard deviation.
There are some basic rules for standard deviation. For example, the data contained within ±1 standard deviation accounts for approximately 68% of the total, and the data contained within ±2 standard deviations accounts for approximately 95% of the total.
Applying this to Bollinger Bands, theoretically the probability that the price will move inside the ±1σ line is approximately 68.2%, and the probability that the price will move inside the ±2σ line is approximately 95%. In particular, if the price touches the ±3σ line, there is an extremely high probability that the price will subsequently fall or rebound.
bollinger bands
Bollinger Bands is a type of technical analysis based on standard deviations.
Bollinger Bands consist of a central moving average and bands drawn above and below it. When the band is narrow, it is interpreted as low volatility in the market. Conversely, when the bands are spreading, we judge that the market is highly volatile.
Before making a breakout, the Bollinger Bands are characterized by a narrower width. Volatility increases triggered by economic indicators and statements by key figures. At that time, there are often breakouts.
By accurately reading the movement of this band, it is possible to determine the timing of breakouts and make effective trades. Bollinger Bands are usually drawn ± 1σ, ±2σ, and ±3σ bands, and these bands widen or narrow sharply to give a sense of the market environment.
Precautions for Forex Volatility Breakout Strategy
The Forex Volatility Breakout Strategy can be very effective, but there are a few things you need to be aware of. Specifically, there are the following three.
・ There is a possibility of falsehood
・ It may differ from past volatility
・ Rapid price movements are likely to occur before and after the announcement of economic indicators.
Let's take a closer look at them one by one.
There is a possibility of falsehood
One major risk when using a volatility breakout strategy is falsehood. False is a phenomenon in which the price changes temporarily and suddenly, but then quickly returns to the original level.

Falsehoods can be a source of significant losses, especially for day traders and scalping traders who trade in a short period of time. Market noise, sudden news, statements by key figures, and various factors can cause false reactions, and it is difficult to predict in advance.
Above is the USDJPY 1-hour chart. In the first half, the dollar-yen fell slowly, and selling intensified sharply, falling sharply to the first half of 144 yen. However, with the start of the NY session and the announcement of economic indicators, we can see that the trend is suddenly changing. After that, the dollar-yen rose sharply from the first half of 144 yen to the second half of 147 yen.
As in the example above, important economic indicators can be preceded by profit-taking selling, which tends to go in the opposite direction of the trend. It is also important to remember that immediately after the release of economic indicators, there is a possibility of large swings up and down.
countermeasure
Measures to avoid false accusations are very important. First, after the breakout has been confirmed, it is useful to use additional verification measures.
For example, you can back it up with other technical indicators or see if the breakout will be sustained for more than a certain amount of time. Immediately after the announcement of economic indicators, it is recommended to wait about 5 minutes before considering entry.
It is also important to create a mechanism that automatically sets the stop loss and set it wide so that the position is not closed when the spread is opened. It is also a good idea to look for a trading auxiliary tool that sets a stop loss in advance as soon as you hold a position.
In addition to Bollinger Bands and ADX, you can combine trend indicators such as candlestick shapes, support and resistance, and moving averages to aim for a more reliable entry. In particular, the breakout in the direction of the trend indicated by the long-term moving average is likely to be large.
May differ from historical volatility
While historical volatility data can be helpful, it doesn't necessarily reflect future behavior. Volatility can be triggered by many external factors, such as changes in market conditions, sudden news, political events, and changes in central bank policy.
For example, in 2015~2016, Brexit in the UK was the main topic of the exchange market, and the volatility of pound-related stocks increased significantly. Every time there was Brexit-related news, there was a big increase in trading volume.
In the 2023 foreign exchange market, attention is focused on policy interest rate trends in each country, and the volatility of the dollar-yen exchange rate, which has the widest interest rate differential, is very high.
Until around 2021, the daily volatility of the dollar-yen was about 50 pips, but as of the end of September 2023, it is about 80 pips, which is 1.6 times the volatility.
countermeasure
Volatility can fluctuate greatly depending on the fundamentals being watched. In particular, news that is in the news, such as major international events such as Brexit and the invasion of Ukraine, consumer price indices, and policy rates in each country can be factors. Understanding these fundamental factors is crucial in predicting market movements.
As a specific measure, we recommend using the ATR to check the average daily volatility. Based on this information, you will be asked to adjust the amount of positions as necessary to accommodate fluctuations in volatility.
Regularly reviewing the daily analysis reports delivered by ThreeTrader will help you get an accurate picture of the day's fundamentals and the movements of the stocks that are in the spotlight.
Before and after the release of economic indicators, rapid price movements are likely to occur.
The release of economic indicators is one of the factors that significantly influence the market.
In particular, U.S. employment statistics, GDP, and central bank (Fed) interest rate decisions move sharply before and after the announcement. The trend is to gradually reduce volatility until the time when key U.S. economic indicators are released. When it comes to important indicators such as the Fed and the consumer price index, there can be a lack of direction for a few days in advance. During a period of narrow volatility, the breakout energy is stored, and the volatility spikes immediately after the announcement to release energy.
This is because many investors and traders use these indicators as clues to predict future developments in the market, which can make the difference between continuing or reversing the trend.
If the content of economic data differs significantly from expectations, the market reaction can be even more intense. Trading under these circumstances is very risky, and if you don't trade carefully, you can end up with unrealized losses in no time.
countermeasure
Since the market is unstable before and after the release of economic indicators, it is effective to take measures such as refraining from trading or reducing positions to avoid risk. It is also important to thoroughly analyze the content of the announcement and the market reaction and adjust your trading strategy accordingly.
For example, if the announcement is much higher than the market expects, the currency may be expected to strengthen. Conversely, if it falls far short of expectations, you can expect a weakening of the currency. In this way, it is necessary to accurately read the content of economic indicators and respond to market movements.
If you understand the strength and weakness of the currency, you will be able to understand which currencies are most bought and sold the most in the exchange market, and it will be easier to consider whether to enter or not. Also, after US economic indicators, cross-yen currency pairs tend to be unstable, so dollar straight currency pairs are recommended.
Take advantage of volatility breakouts with Threetrader
Breakouts usually tend to be less volatile before they occur. Capturing this period of low volatility well can help you predict the timing of breakouts more accurately. By leveraging Threetrader's advanced charting tools, you can easily identify such periods of low volatility.
Additionally, the longer the period of low volatility, the more likely the price movement after a breakout occurs is also over a longer period of time, so it is important to understand this trend and develop your strategy. With this in mind, if you see low volatility for a long period of time, you will have a better chance of making big profits on subsequent breakouts.
Volatility can be checked using technical indicators such as ATR (Average True Range). Threetrader offers advanced analytical tools that allow you to see these technical indicators in real-time. In addition, Threetrader's platform is difficult to widen, so you can continue trading with peace of mind in the event of sudden price fluctuations.
Threetrader also offers a wide range of risk management tools. It is easy to set stop loss and take profit, which minimizes risk in the event of sudden price movements.
As such, Threetrader is a very suitable platform for volatility breakout strategies. Use the above points to minimize risk and maximize returns.
Summary|FX Volatility Breakout
In this article, we have explained in detail about "Forex Volatility Breakout". Hopefully, you now have a better understanding of the fundamentals of volatility breakouts, strategies and indicators, and the risks to watch out for and what to do about them.
Volatility breakout strategies are a powerful technique for taking advantage of market swings to pursue profits, but a cautious approach and risk management are essential. However, if you take advantage of the risk measures and indicators introduced in this article, you can reduce your risk and improve your trading success rate. As a result, you'll be able to minimize risk and maximize returns.
Volatility breakout strategies capture market fluctuations and provide profitable trading opportunities for traders. Incorporate that power into your trades to maximize your profits.

